

Be prepared to be shocked, mass migration is underway and Arizona life is being changed slowly. Real estate prices are not coming down anytime soon and the election will have no impact on home prices, so if you’re waiting don’t. There are not a lot of good options out there because if you rent, rents have risen so much that it’s not affordable and if you buy, you can get priced out of the market, luckily low-interest rates are making things affordable. I feel like I have a good hold of what’s going on, but I’ll let the charts do the talking. The market is predictable and if you can understand it, the fear subsides. Please don’t listen to the news.
These numbers are for the Phoenix metro area.
Let’s get into it:
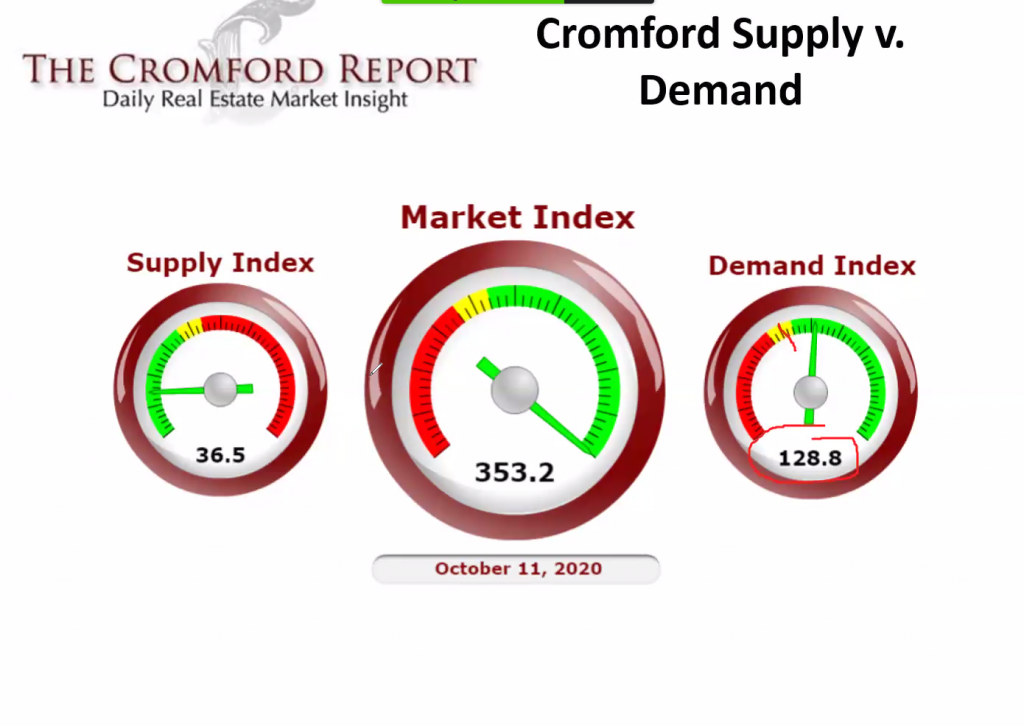
Here is the market index of 353.2 which is a record from the Cromford report. In 2005 the index was at 313. We are in a record seller’s market right now.
Cromford Market Index™ is a value that provides a short term forecast for the balance of the market. It is derived from the trends in pending, active, and sold listings compared with historical data over the previous four years. Values below 100 indicate a buyer’s market, while values above 100 indicate a seller’s market. A value of 100 indicates a balanced market.
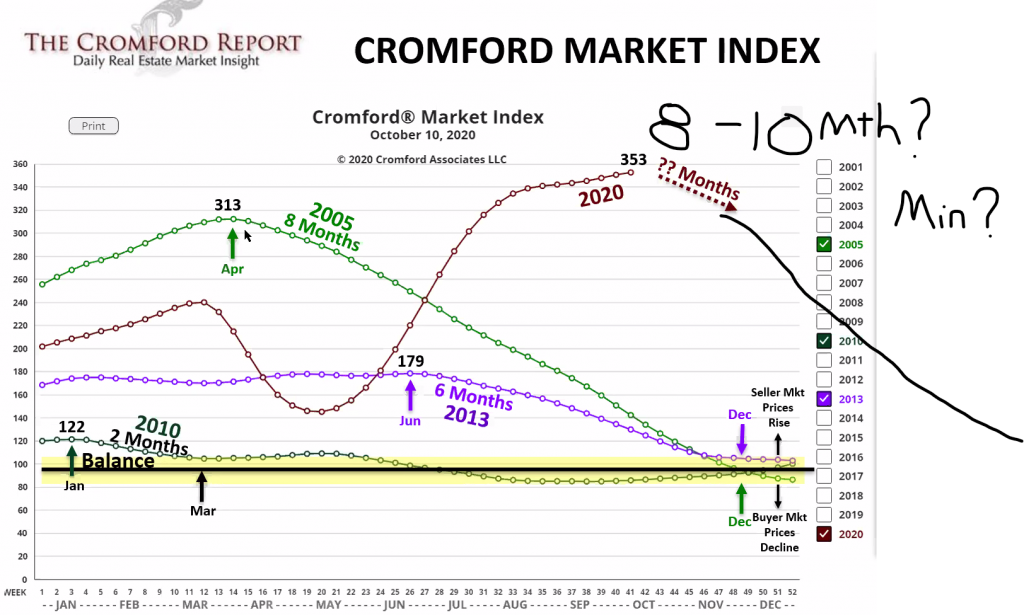
And here is a very important real-life chart on how the Cromford market index works going back to 2005 and how it reacted then. In 2005 the market index hit a record high at 313, remember 100 is balanced. It took 8 months for it to go to a buyers market, (under 100) and that’s with all the bad lending practices back then. So this is why we say 8-10 months min that prices could even turn around and become a buyers market. With good lending practices, low supply, and true qualified buyers in the market, I’d stick my neck out and say 1-2 years before we even stabilize or get close to a buyers market. And that’s with a lot happening in the markets and the world which could happen, but chances it could stabilize for many years.
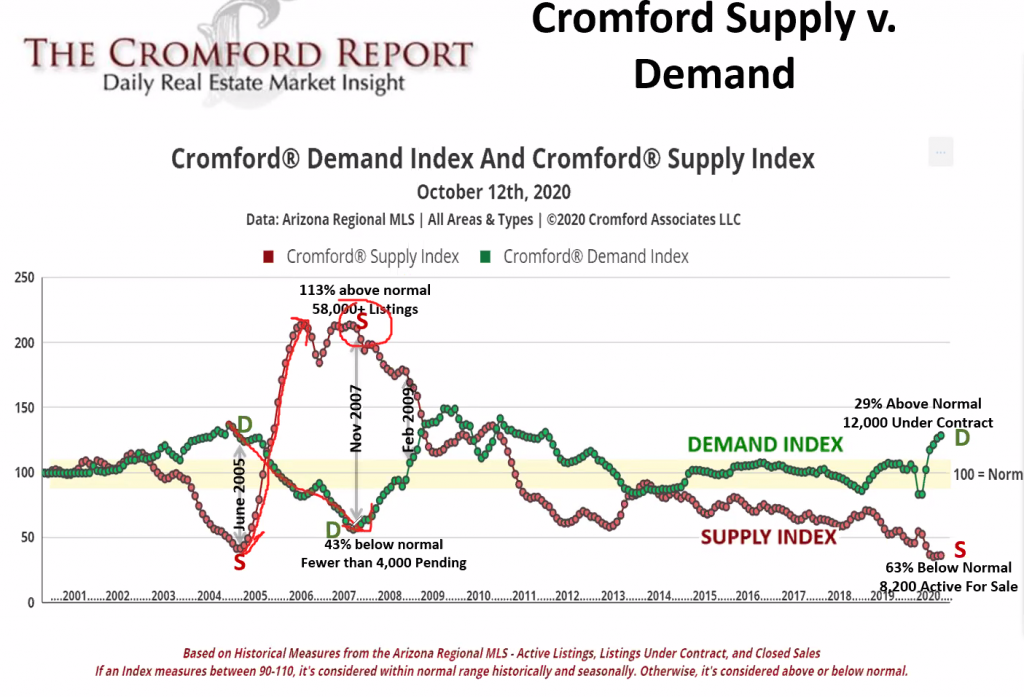
This chart shows the Demand / Supply indexes where we have 29% above normal homes under contract and 63% below normal active homes for sale. The red line and the green line would have to cross before our market to become balanced, and I just don’t see that happening anytime soon
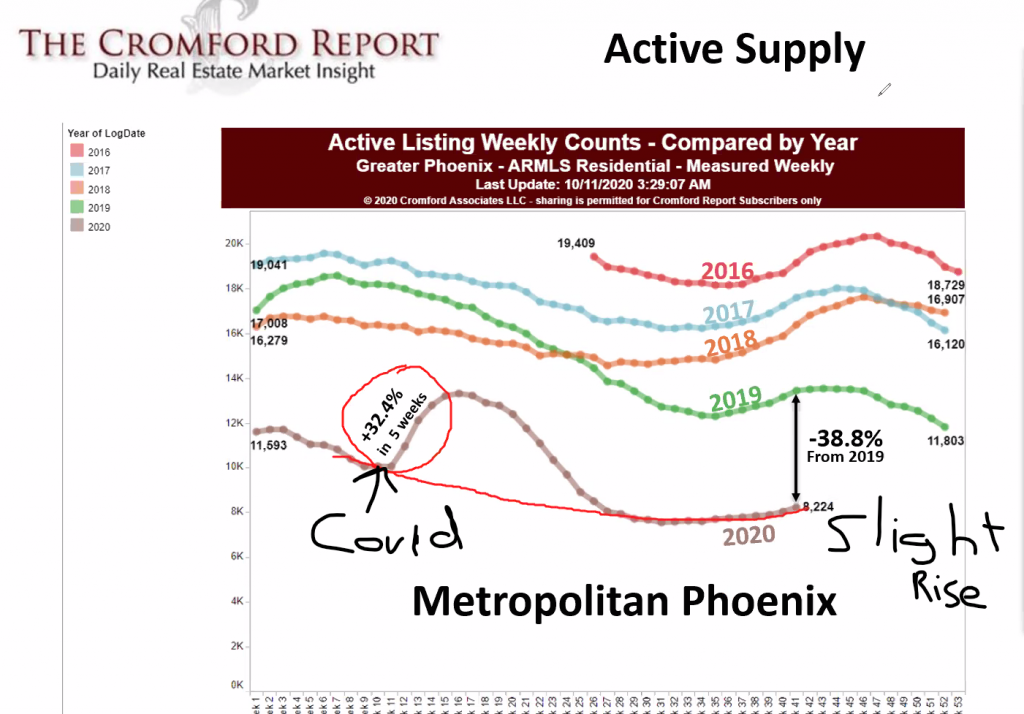
This chart shows the active supply over the last 5 years with a -38.8% decrease in listings from 2019. Crazy times……
But in the past few months, it looks like it’s headed up. As you see we had a 5-week panic attack from Covid where listings grew 32.4%. Always remember that the housing market is predictable with supply/demand, don’t watch the news, elections don’t sway the market, and changes happen very slowly.
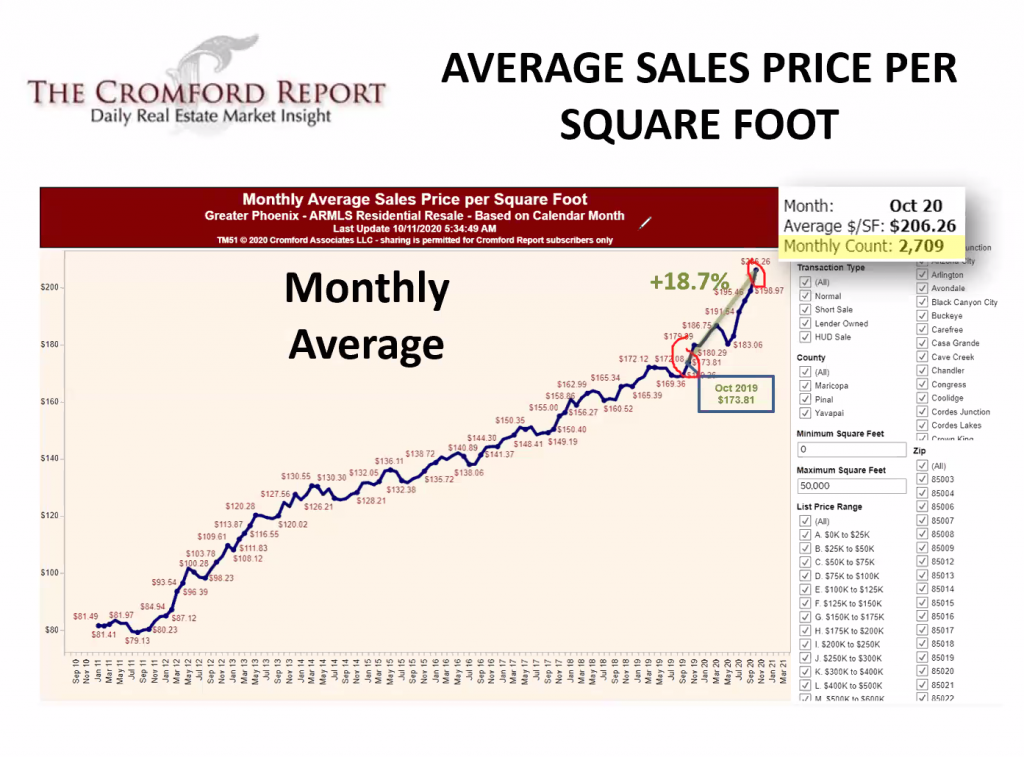
In this chart price per sqft increases fairly dramatically, yes I know what you’re thinking, this can’t last forever. I said that 4 years ago.
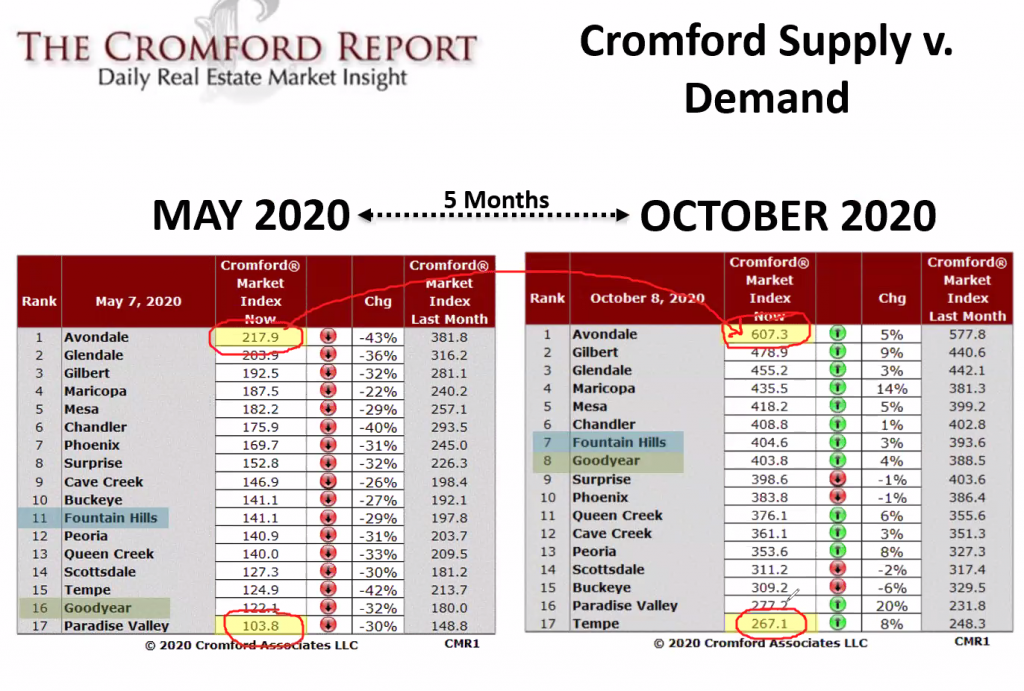
In this chart, this shows the winning cities for appreciation, for instance, Avondale is the clear winner but Fountain Hills, and Goodyear had the most gains since May. If you’re an investor these are the places you want to invest.
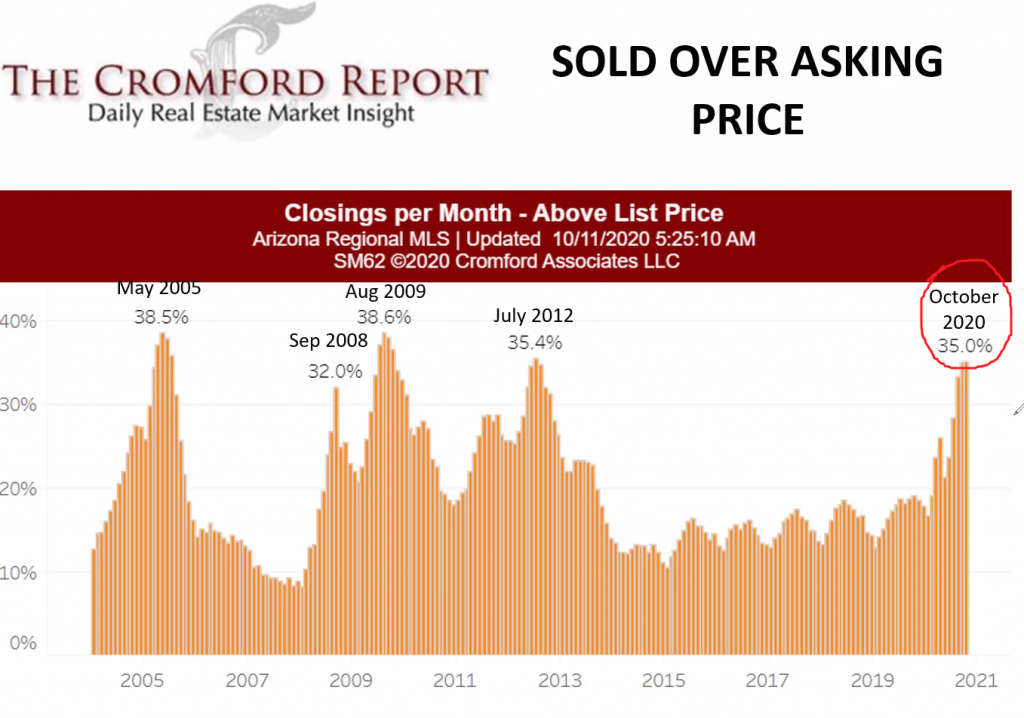
35% of all homes sold were over asking price. LOL, I tell people this and they never believe me 🙁
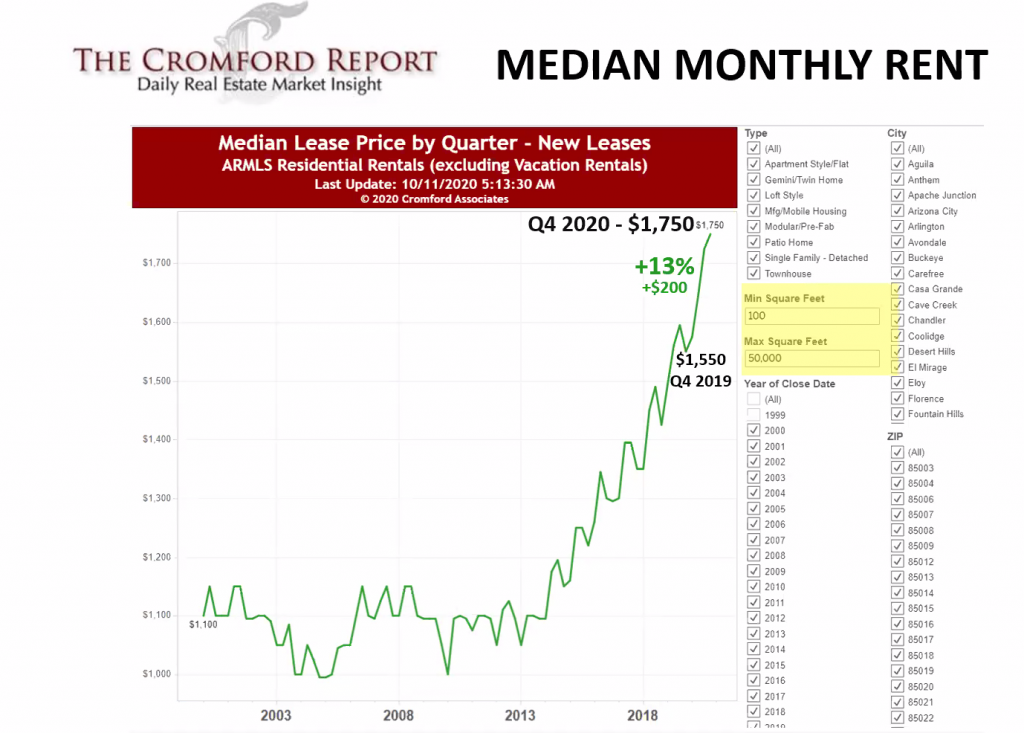
This is the scary chart that’s going to lead to homelessness. Rent as you know has been rising rapidly which is good for landlords but not good for renters. This is true demand unlike in 2005 when that boom was taking place rent was actually going down, because there was no true supply/demand like now, it was speculation and a lot of the homes back then were vacant.
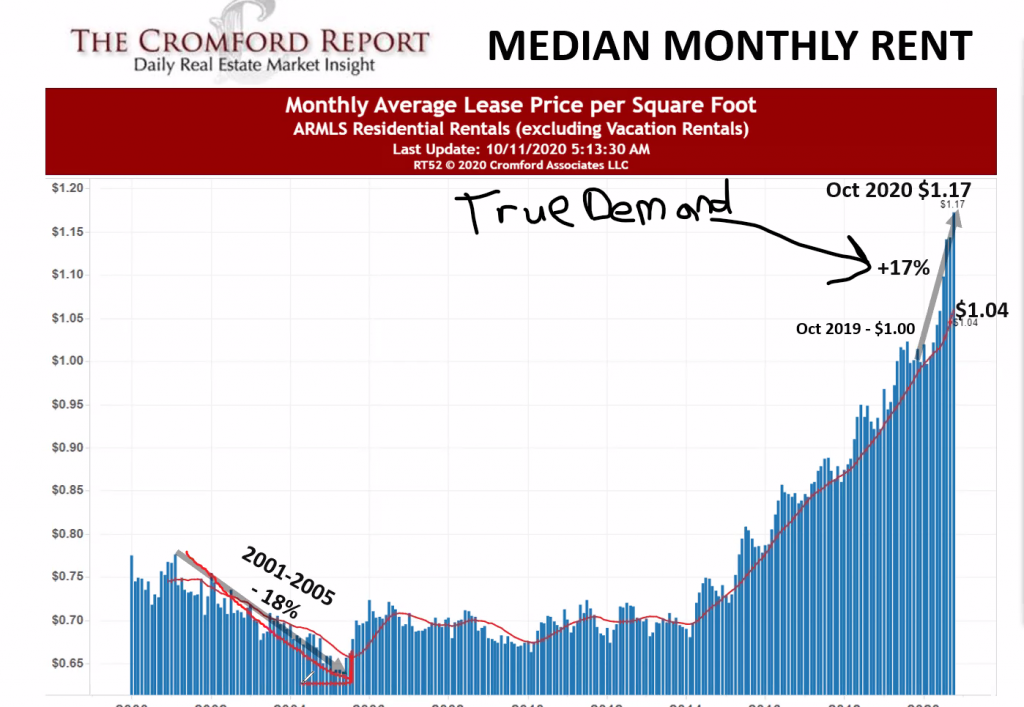
In Quarter 4 rent has jumped up to $200 alone. This is scary stuff.
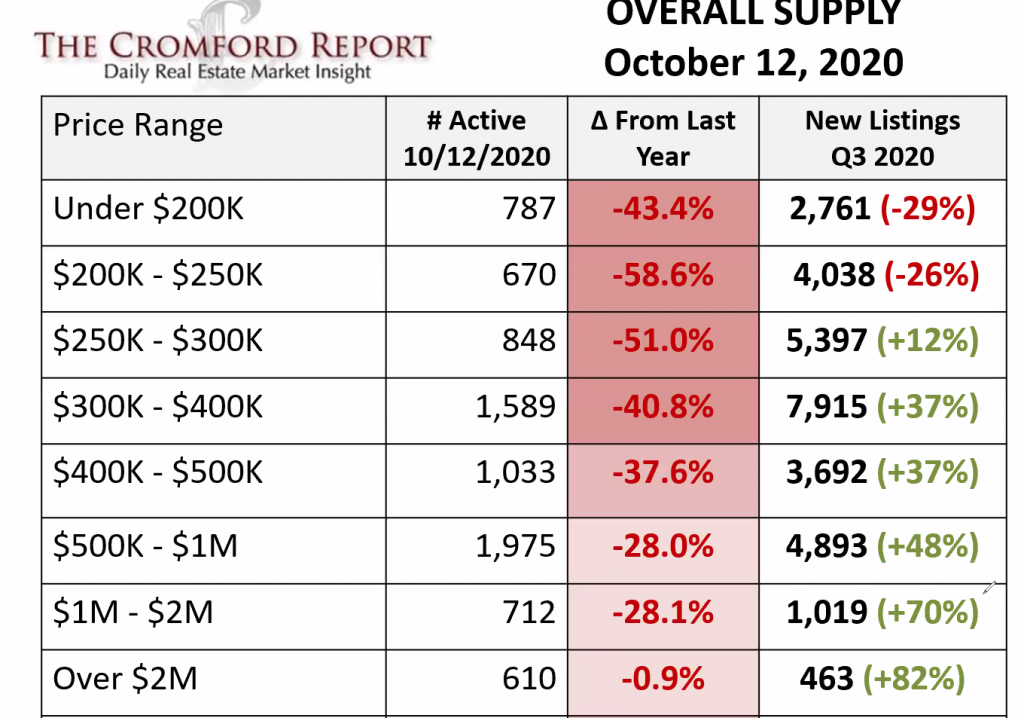
This chart shows where most of the lack of supply comes from, mostly the cheaper homes of course. These people are then forced to rent if they cannot find a home and you saw the last chart right.
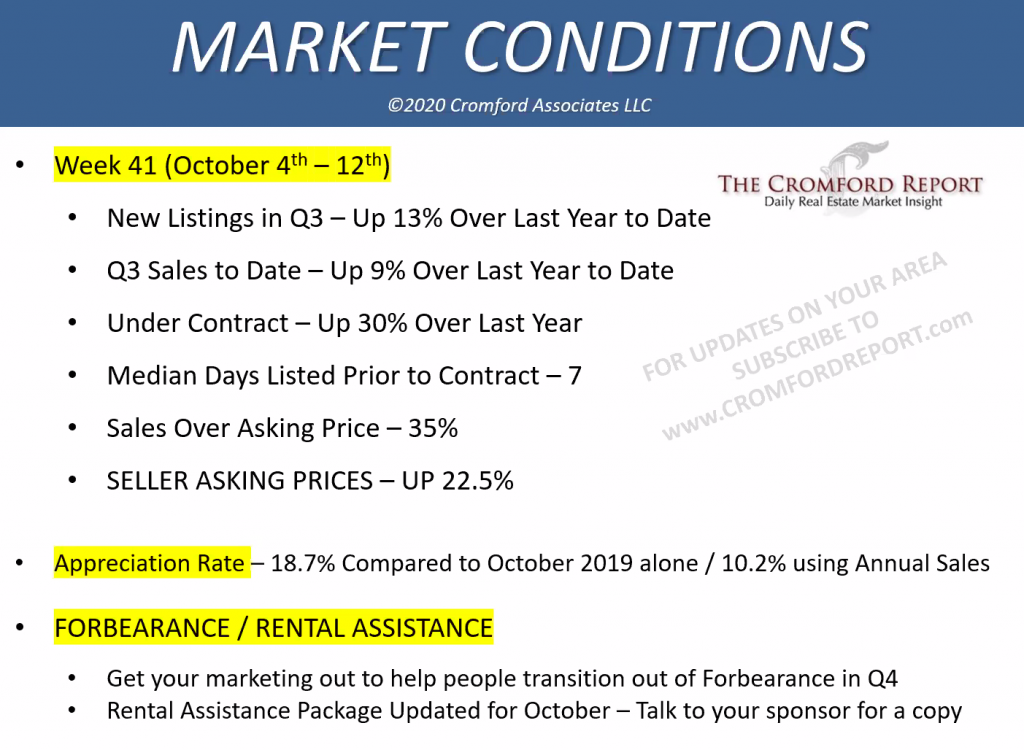
The main number to concentrate on is the appreciation rates. Can you believe this? I’ll try to explain:
Year over year from October to October the market increased by 18.7%! This number is insane, your house of $300000 went up to $56,100 in one year. Actually, if someone could fact check me please do. This is why we’re told to use 10.2% for annual sales.
I’m exhausted just looking at this, who would have thought. The Californians really don’t like it there and are being forced to move because of homelessness, fires, politics, and the taxes. Arizona is just a well run state and people recognize this. I’m not sure if this scares you or encourages you to buy or sell, I’m not trying to convince you to do either, I just want to give you the information. I just want to be clear, if you’re waiting for prices to come down, they’re not, I don’t care what website you went to, these are facts. Of course, there is many more charts, so please don’t be scared to ask or get an explanation, I feel like I have a really good understanding of the market now.
Call me at 480-466-4917
jay@jaybrugroup.com
Jay Bru
Here is some more interesting information if you’d like to keep reading
Residential builds by decade. Very interesting, on how the valley has expanded over the years and lets you know where your best chance you can find new builds and where to avoid older homes.
https://azmag.maps.arcgis.com/apps/MapSeries/index.html?appid=cac744bd26094291a60497766322efed
COVID-19 RENTAL ASSISTANCE RESOURCES
https://assets.noviams.com/novi-file-uploads/ama/COVID-19/AMA_EPRA_Resources__10-2-20_.pdf
Watch Fletcher Wilcox from the Wilcox report explain why the election will not impact home prices: